Data Visualization with Chart.js & HTML5 Canvas
They say information is power, but to transform information into work, you need to make it compelling and accessible. Sure, you can kludge something together out in Office or beg your graphic design to mock something up, but there are better more efficient ways. Chart.js is a JavaScript library which dynamically transforms your information/data into a versatile array of charts, graphs and can even animate it. And it is easier than you think!
The Basics
You’ll need to embed the Chart.js library in your page/file. You can embed the library either a local copy or using the Chart.js CDN (Content Delivery Network).
<script src="https://cdnjs.cloudflare.com/ajax/libs/Chart.js/2.7.2/Chart.min.js"></script>
We’ll also need to create a canvas space where the chart will be drawn. The size isn’t important, as long as it is large enough to fit your visualization clearly and fits into your page layout. Chart.js even supports responsive design, so you have some option on multiple device types/sizes if you need it.
<canvas id="polar-chart" width="800" height="450"></canvas>
Create Data Set
In this demo, we’re just going to set some simple variables, but you can embed an external data file or in more advanced implementations, pull your data from a database (using PHP, Python, etc). Going with the external or called data method, you can even choose to have different visualization or data segment portrayals on different pages. Update this data and all your visualizations should update immediately as well.
<script>
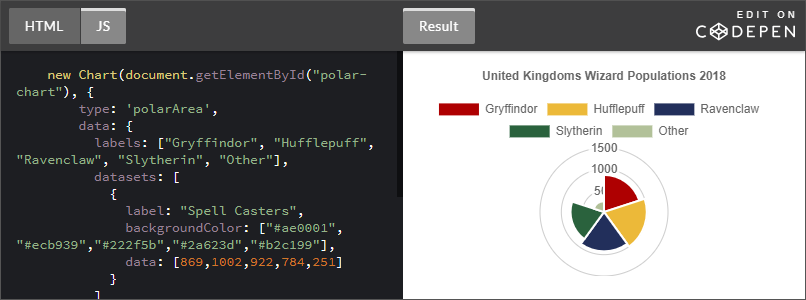
new Chart(document.getElementById("polar-chart"), {
type: 'polarArea',
data: {
labels: ["Gryffindor", "Hufflepuff", "Ravenclaw", "Slytherin", "Other"],
datasets: [
{
label: "Spell Casters",
backgroundColor: ["#ae0001", "#ecb939","#222f5b","#2a623d","#b2c199"],
data: [869,1002,922,784,251]
}
]
},
options: {
title: {
display: true,
text: 'United Kingdoms Wizard Populations 2018'
}
}
});
</script>Demo
Click to Demo
Chart.js Options
There are a TON of options in Chart.js and they provide plenty of examples and nice configuration documentation, so poke around and experiment to find the ones that work best for your project. Feel free to use the demo at CodePen to give it a try.
Further Reading: